The International Building Code (IBC) and ASCE 7-22 require seismic site classification for most new construction in the Jackson metro area, and the local geology makes this more than a paperwork exercise. Jackson sits atop the Jackson Dome, a buried Cretaceous volcanic structure that has uplifted and fractured the overlying Eocene Yazoo Clay and Cockfield Formation. The result is a subsurface where competent limestone can transition to deeply weathered clay within the span of a single building footprint. Seismic tomography provides the continuous velocity cross-sections needed to map these transitions, feeding directly into Vs30 calculations and foundation design decisions. Standard borings alone often miss the lateral variability that the MASW method captures in surface-wave mode, but when we need high-resolution depth control—especially for locating top-of-rock beneath karst features—refraction tomography paired with a seismic refraction survey gives the engineering team a velocity model tied to actual wave propagation paths through the ground.
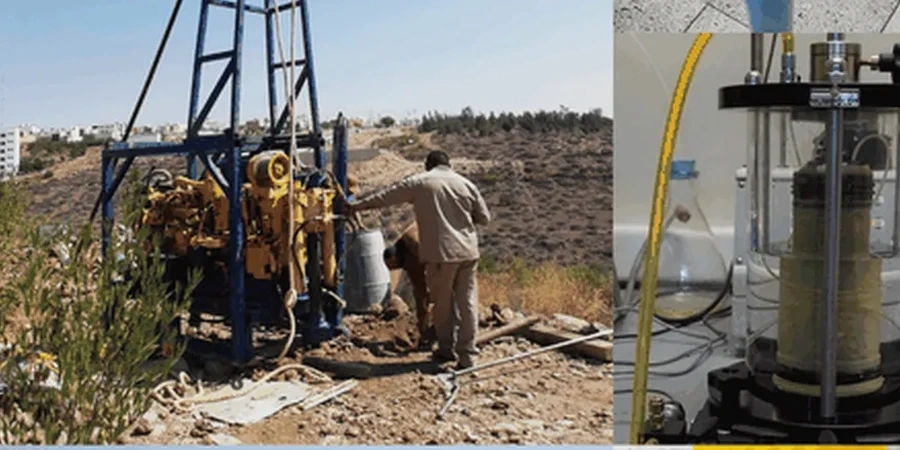
A seismic velocity model resolves the irregular bedrock surface beneath Jackson’s Yazoo Clay, reducing the risk of missing karst features that can delay foundation construction.
Local geotechnical context
The contrast between the Belhaven neighborhood and the industrial corridor along Gallatin Street illustrates the risk variability across Jackson. In Belhaven, historic homes and institutional buildings sit on a relatively shallow limestone shelf, and the main concern is differential settlement where clay-filled solution channels cut through the rock. Over near the Pearl River floodplain, the Yazoo Clay can be 50 feet thick or more, with a high shrink-swell potential and a shear-wave velocity below 600 ft/s that pushes site classification toward Class E or F per ASCE 7. Building on either profile without a velocity model invites surprises during excavation. The more expensive scenario is missing a deep karst cavity: a drilled shaft installed into what appeared to be competent rock can lose bearing if the limestone bridge over a void collapses during construction. Seismic tomography, particularly when combined with stone column ground improvement in the soft clay zones, gives contractors and structural engineers a basis for sizing foundations that account for the actual stiffness contrast between adjacent soil and rock units.
Quick answers
What does a seismic tomography survey cost for a typical commercial site in Jackson?
For a commercial lot in the Jackson metro area, a refraction tomography survey typically falls between US$2,980 and US$5,410. The range depends on the length of the seismic spread, the number of geophone channels required, site access conditions, and whether s-wave reflection or cross-hole testing is added to the scope. A warehouse site with a 230-foot line and straightforward access will be at the lower end; a site requiring multiple lines, brush clearing, or overnight deployment in a high-traffic area will trend higher.
How deep can seismic refraction tomography see beneath the Yazoo Clay in Jackson?
The practical depth of investigation is roughly 15 to 20 percent of the total spread length, so a 500-foot geophone line can resolve velocity structure to approximately 75 to 100 feet below grade. In Jackson, where the Yazoo Clay often extends 30 to 60 feet deep before hitting limestone of the Jackson Dome, we typically design the spread so the deepest ray paths refract along the top of competent rock. If the limestone is deeper than 100 feet or if the velocity contrast between the clay and weathered carbonate is weak, we may recommend supplementing the surface survey with a downhole seismic test or a deeper boring with geophysical logging.
Which seismic method is better for Jackson’s geology: refraction or reflection?
For most Jackson sites, refraction tomography is the primary method because it directly maps the velocity increase at the soil-bedrock interface, which is what foundation engineers need to know. Reflection profiling becomes useful when the target is a velocity inversion—for example, a soft clay layer beneath a desiccated crust—or when the project requires imaging near-vertical faults associated with the Jackson Dome uplift. We often pair both on larger projects: refraction for the bedrock surface and Vs30 estimate, reflection for stratigraphic detail within the overburden.