← Home · Geophysics

Electrical Resistivity Surveys (VES) in Jackson, Mississippi

Together, we solve the challenges of tomorrow.

LEARN MORE →

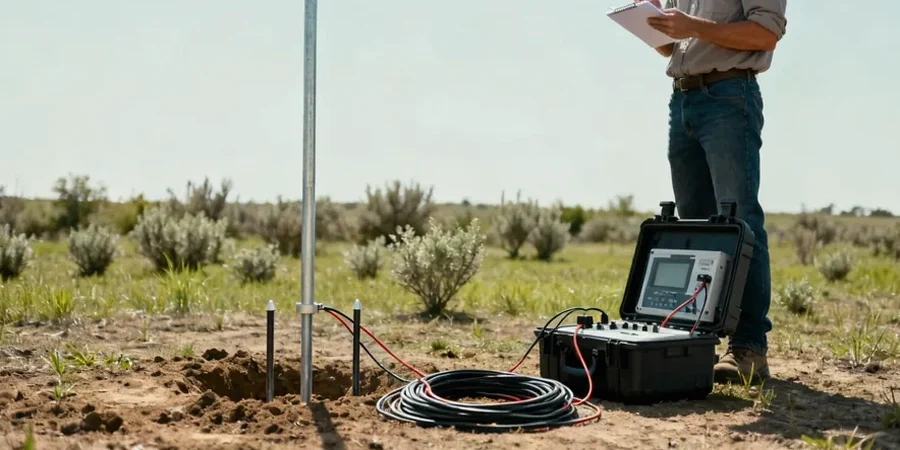
A developer broke ground on a new mixed-use building off I-55 near Fondren last spring. The initial borehole showed stiff clay to 15 feet, but the contractor suspected deeper sand lenses from the old Jackson Formation. We ran a VES survey across the lot. The resistivity data mapped a low-resistivity zone dipping southeast—classic Yazoo Clay over a high-resistivity sand layer at 30 feet. That sand was missed by the first two borings. In Jackson, where subsurface stratigraphy shifts drastically between the Pearl River floodplain and the upland loess bluffs, relying on discrete borings alone can miss transition zones. We use test pits to ground-truth shallow anomalies and CPT soundings to calibrate resistivity profiles with continuous tip resistance data. Our VES method provides a non-invasive cross-section before heavy equipment ever moves onsite.

Resistivity doesn't replace drilling—it extends what a few well-placed borings tell you across the entire site.

How we work

Jackson's urban growth followed the high ground east of the Pearl River, but postwar expansion pushed development onto the Yazoo Clay plains north of County Line Road and the alluvial terraces south of Highway 80. These deposits present very different resistivity signatures: dry loess on the bluffs reads high, while saturated Yazoo Clay reads low—sometimes below 10 ohm-m. A single VES sounding can penetrate 100 feet or more, resolving layer boundaries without drilling. We deploy a Schlumberger array with current electrode spacings up to 300 feet for deep profiles. Data inversion yields layer resistivity and thickness. When combined with grain-size analysis from select boreholes, the resistivity model translates directly to lithology: sand, silt, or clay. For sites near the Ross Barnett Reservoir, where seasonal water table fluctuation changes bulk conductivity, we run repeat soundings to confirm dry-season versus wet-season baselines. The result is a stratigraphic model that covers the entire footprint, not just point locations.
Electrical Resistivity Surveys (VES) in Jackson, Mississippi
Technical reference image — Jackson Mississippi

Local geotechnical context

In Jackson, the biggest subsurface surprise is a sand lens trapped inside a Yazoo Clay sequence. It looks like stiff clay at the surface, but that sand can carry groundwater under pressure. A VES sounding catches it because the sand's resistivity spikes to 80–150 ohm-m against a clay background of 5–15 ohm-m. Miss it, and your dewatering plan fails the first time you cut into it. We've seen this repeatedly on sites east of the Jackson-Evers Airport, where Pleistocene terrace sands interfinger with marine clay. Another risk: assuming uniform clay thickness across a site. Resistivity data from three or four soundings can reveal a paleochannel cutting through the clay—a low-resistivity trough that spells differential settlement. Integrating VES with slope stability analysis becomes essential when that channel runs near a planned excavation wall.

Need a geotechnical assessment?

Reply within 24h.

Email: contact@geotechnical-engineering1.org

Watch the video

Technical parameters

ParameterTypical value
Array configurationSchlumberger (standard); Wenner for lateral resolution
Max investigation depth100–150 ft typical; 200+ ft achievable
Electrode spread (AB/2)1.5 to 300 ft
Typical resistivity range5–200 ohm-m (Yazoo Clay); 50–500+ ohm-m (loess/sand)
Data inversion method1D layered inversion; 2D pseudosection if multiple spreads
OutputResistivity vs. depth curve; interpreted lithologic column
ASTM referenceASTM D6431 (surface geophysical methods)

Related services

01

1D Vertical Electrical Sounding (VES)

A single-location depth sounding using Schlumberger array. We expand electrode spacing stepwise to build a resistivity-versus-depth curve at one point. Ideal for determining layer thickness, depth to bedrock, or water table depth at a critical footing location.

02

2D Resistivity Profiling

Multiple VES soundings along a survey line, processed into a 2D resistivity cross-section. We use this to map lateral changes—sand channels, clay pinch-outs, buried fill—across a building footprint or pipeline alignment.

Relevant standards

ASTM D6431-18 (Standard Guide for Using the Direct Current Resistivity Method for Subsurface Site Characterization), IBC 2021 (International Building Code — geotechnical investigation requirements), ASCE 7-22 (Minimum Design Loads — subsurface characterization for seismic site class), Mississippi Department of Environmental Quality (MDEQ) — groundwater investigation protocols

Quick answers

What's the cost of a VES survey in Jackson, MS?

A single 1D VES sounding typically ranges from US$690 to US$920, depending on access conditions and max depth. A 2D profile with multiple soundings scales with the number of stations. We quote per survey after reviewing your site plan.

How deep can electrical resistivity survey in Jackson's soils?

With a Schlumberger array and AB/2 spacings up to 300 ft, we routinely reach 100 to 150 feet. The practical limit depends on site size and subsurface resistivity contrast. In Jackson's Yazoo Clay, the signal attenuates quickly at depth, so maximum penetration is typically around 150 feet.

Can VES tell the difference between Yazoo Clay and sand?

Yes, very clearly. Yazoo Clay in Jackson reads 5–20 ohm-m when saturated. Clean sand or loess reads 50 ohm-m and above. The contrast is sharp, making layer boundaries easy to pick in the inverted resistivity model.

Do you need borehole calibration for resistivity data?

We strongly recommend at least one calibration borehole. Resistivity gives you electrical properties; a borehole ties those to actual soil type. Without calibration, you're interpreting lithology from resistivity alone—which works well in Jackson's simple clay-sand sequences but adds uncertainty in mixed soils.
Location and service area

We serve projects in Jackson Mississippi and surrounding areas.

View larger map